
Opinion: The stock market has had trouble holding new highs, but it’s
The stock market, as measured by the S&P 500 Index
SPX,
has had trouble holding breakouts to new highs.
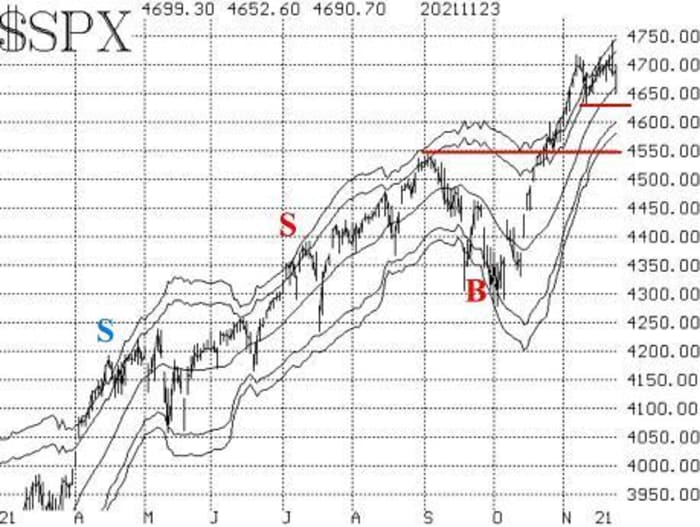
Seven times this month, it has probed above 4705 points — including what seemed to be (at the time) a strong move to 4743 on Nov. 22. But each time, it has fallen back to close below 4705. As a result, that is a resistance area until SPX can close above that level. There is support at 4630.
The ”classic” modified Bollinger Band sell signal remains in effect, but a full-blown McMillan Volatility Band (MVB) sell signal will not take place until SPX closes below 4630.
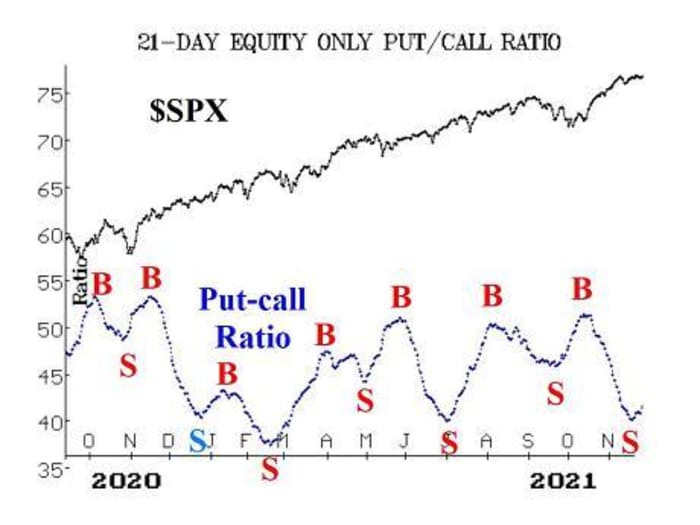
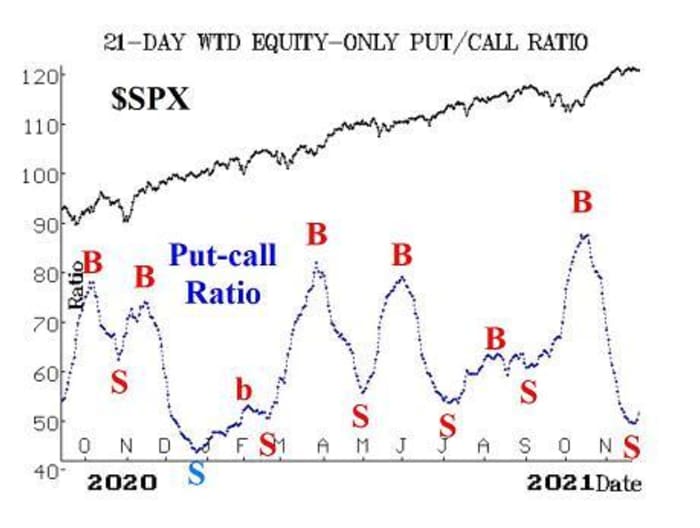
Both equity-only put-call ratios remain strongly on a sell signals. This is now obvious to the naked eye, after the computer analysis programs “called” these sell signals last week. They will remain bearish until they roll over and begin to trend downward again.
Breadth has been quite negative lately, but surprisingly not very negative yesterday (Nov. 23), when SPX was down sharply for most of the day. The breadth oscillators remain on sell signals, but a couple of days of positive breadth could easily generate a buy signal. Cumulative breadth indicators, meanwhile, are not near all-time highs, having backed off over the past couple of weeks.
New 52-week lows on the NYSE took charge over new 52-week highs. So this indicator is now on a sell signal, too. It will continue to be until new highs lead new lows for two consecutive days. As has been the case for some time, “stocks only” and Nasdaq data show a much more negative situation as new lows are dominating there.
VIX seems to be trying to rally, but it is not “spiking.” It’s oozing upward. As a result, even though VIX is above its 200-day moving average, we do not consider this to be a sell signal. A sell signal would be generated if both VIX and its 20-day moving average closed above the…
Read More: Opinion: The stock market has had trouble holding new highs, but it’s