
S&P 500 Earnings And Bond Market Thoughts: Higher Rates Could Negate
Jira Pliankharom/iStock via Getty Images Treasury yield curve

This blog’s start this week will be completely different, since we’re starting with some bond market commentary and thoughts.
The above spreadsheet begins with the Treasury yield curve as of 10/31/21, just before Jay Powell and the FOMC announced the taper, the week of November 5th, 2021, through Friday’s, January 14th, 2022, close.
Look at the change in the 2-year Treasury yield, just since January 1, 22:
- The 2-year Treasury yield rose 4 bps in November ’22 to 52 bps;
- The 2-year Treasury yield rose 21 bps in December ’22 to 73 bps;
- The 2-year Treasury yield rose another 26 bps to 99 bps the first 14 days of 2022;
- The 10-year Treasury yield rallied 13 bps in November ’22 to 1.43%;
- The 10-year Treasury rose 8 bps in December ’22 to 1.51%;
- The 10-year Treasury yield has risen a healthy 26 bps in the first 14 days of ’22 to 1.77%;
The 10-year Treasury yield has now closed above the March ’21, 1.75% peak, for two weeks in a row.
Return data source: Morningstar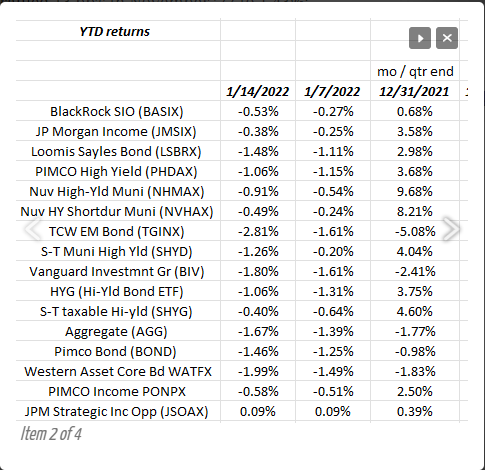
This second spreadsheet was actually started during the depths of the market corrections in March, ’20 and it’s still updated today, every weekend. These bond funds try and cover the scope of the bond markets, although other data not shown tracks the indices. The column to the right is full-year 2021 returns, but the two columns following show returns the first two weeks of 2022.
2022 could be rough on the bond market asset classes, much like 1994.
BlackRock’s Rick Rieder and a slide from this week’s conference call:
BlackRock’s Rick Rieder
BlackRock’s Rick Rieder does a monthly conference call for investors and it’s one of the best 30 – 45 minutes spent each month. This Thursday morning, January 13, 2022, on page 7, Rick noted that it looks like many of the various inflation indicators are starting to roll over, or the “rate of change” is starting to decelerate.
Bespoke’s detail this week tracking the omicron data (p. 3 of the Bespoke Weekly Report, shows New York cases starting to roll over.
What got my attention was the top, middle graph, or the PCE trend.
S&P 500 earnings data:
- The forward 4-quarter estimate this week rose to $223.57 from last week’s $223.25, and two weeks ago $216.14. Remember, with each new start to a quarter, the forward estimate jumps sharply as the new quarter is added, and the trailing quarter falls off.
- The PE on the forward estimate is now 21x versus the same multiple last week;
- The earnings yield rose this week to 4.79% from last week’s 4.77% and two weeks ago 4.54%. The earnings yield might tell the story this year, if the S&P 500 falters and doesn’t produce the kind of historical returns it has (which we expect to happen), and yet S&P 500 earnings remain robust. In other words, flat S&P 500 in the midst of strong earnings will see “PE compression” and a rising S&P 500 earnings yield.
Commentary on Friday’s bank earnings: the reporting…
Read More: S&P 500 Earnings And Bond Market Thoughts: Higher Rates Could Negate