
At least 6 signs show the stock market is starting to break down
Strap in! It could be a bumpy ride this year.
Financial markets are off to a woeful start for the bulls in 2022. Blame surging inflation, an out-of-step Federal Reserve, or a nagging pandemic. But whatever boogeyman market participants identify, there are clear signs that the market is experiencing signs of wear and tear.
Here are a few market-based indicators that imply more bumps in the road ahead, or at least highlight the uneven path of market traversed thus far.
Tech wreck
The Nasdaq Composite
COMP,
has been in a downward spiral. The popular technology index on Wednesday logged its first close in correction territory since March, closing 10.69% below its Nov. 19 record peak and meeting the commonly used definition for a correction.
On top of that, the Nasdaq Composite on Tuesday notched its first close below a closely watched, long-term trend line since April of 2020—its 200-day moving average. The breach of its 200-day may be a more compelling cause for concern for optimistic investors, given how long the index was able to stay above that level.
Death cross for the smalls
The small-capitalization focused Russell 2000 index’s 50-day moving average fell below its 200-day moving average. A “death cross” appears when the 50-day moving average crosses (DMA) below the 200-DMA, which many chart watchers say marks the spot a short-term pullback graduates to a longer-term downtrend.
Small-caps, as measured by the Russell 2000 index
RUT,
have fared almost as badly as technology shares, down 8.1% in the year to date.
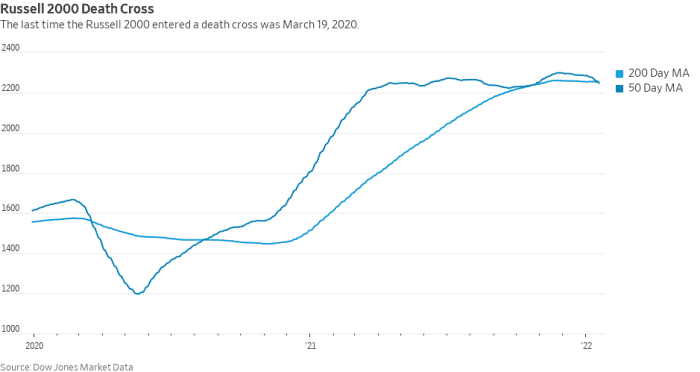
Dow Jones Market Data
According to the folks at Dow Jones Market Data:
- Since inception, the Russell 2000 has entered into a death cross twenty-six times, including Wednesday’s entrance
- The average amount of trading days the 50-day moving average stays under the 200-day moving average is 104 trading days
- In 2020, the index spent 103 trading days with the 50-day moving average below the 200-day moving average
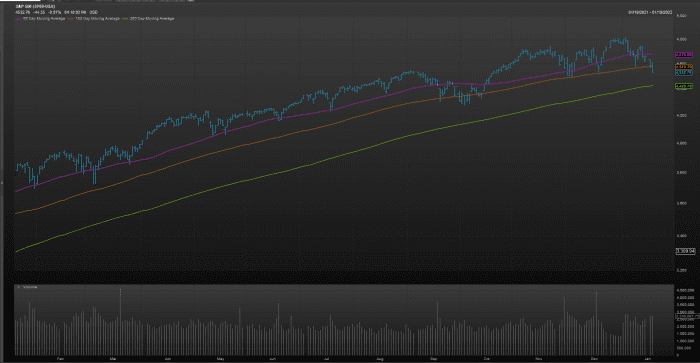
The S&P 500’s 100
The S&P 500’s midterm moving average, its 100-day, was breached on Wednesday. The broad-market index hasn’t closed below that level since around October of 2021. Falling below that mark now may signal that the 200-day trend line may be next to fall.
FactSet Inc.
…
Read More: At least 6 signs show the stock market is starting to break down